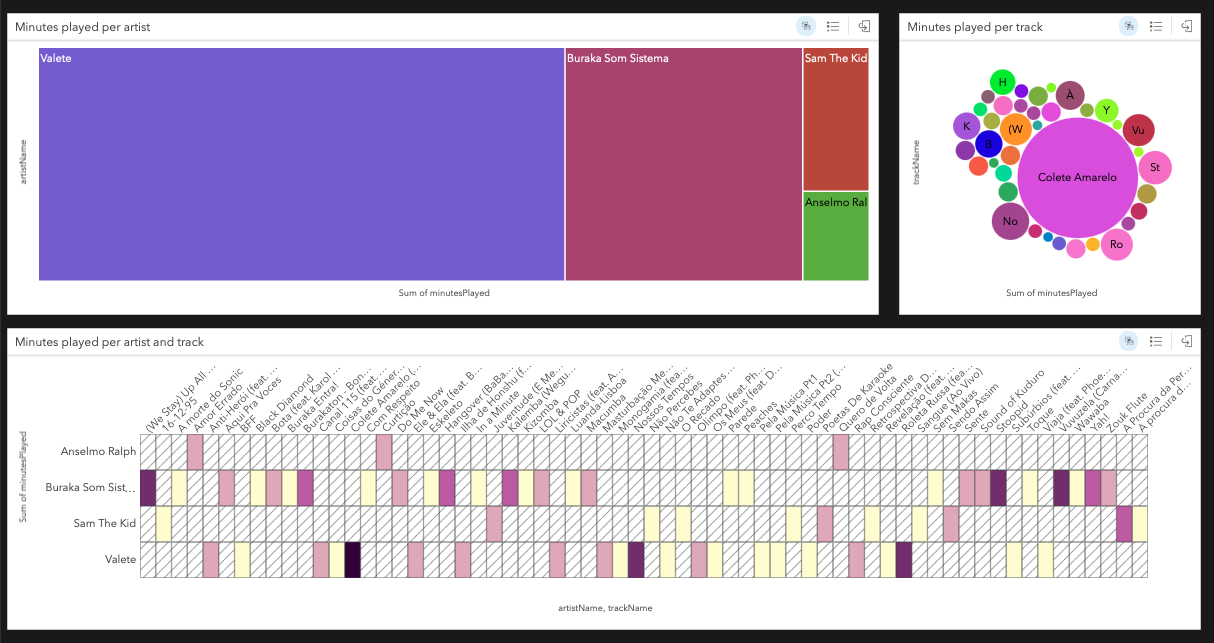
You’re sitting on a data goldmine! Visualise what you listen to on Spotify with ArcGIS Insights

Source your listening data, get started with ArcGIS Insights and build visualisations that stand out!
What's included?
3 activities: slide decks will provide you with all the necessary steps to perform the activities.
1 dataset: if you don't have a Spotify account but still want to create a visualisation around online streaming, I'll share a sample dataset with you.
Curriculum
- Welcome to the course!
- Before we begin...
- Activity 1 – Get your Spotify data
- Activity 2 - Become familiar with ArcGIS Insights
- Activity 3 – Create a visualisation of your listening data
- Next steps
- Before you go...
What exactly is this mini-course?
This is a self-paced, online-based mini-course that will lead you through accessing your Spotify data and revealing its hidden insights, using ArcGIS Insights (pun intended!). You will go through the activities, in sequential order, in your own time.
What if I do not use Spotify but still want to enrol in this mini-course?
Worry not! You will still be able to follow the activities with a sample dataset I'll provide you.
What software will I be using?
You'll be using ArcGIS Insights from Esri.
Are there any assessments?
The true, final assessment will be the mastery, and the creativity revealed in your ArcGIS Insights page! Share it with your social network and receive feedback.
How long is this mini-course?
You'll need about an hour to complete this mini-course.
Are there any prerequisites, or do I need any prior knowledge of particular topics?
Absolutely not! This is a mini-course suitable for beginners who want to learn to create data visualisations with ArcGIS Insights or non-beginners who wish to visualise their listening data from Spotify better.
What are the technical requirements?
A computer, an internet connection, a web browser, and that is all! There will be activities to assist you in downloading your Spotify data and creating an ArcGIS Online account.

